Unraveling the World of Data: Fundamental and Technical Data Sources
In the realm of finance, data serves as the backbone of informed decision-making. Traders and investors rely on two primary types of data – fundamental and technical – to analyze financial markets and identify potential opportunities. Let’s explore these data sources in a concise and engaging manner:
- Fundamental Data Sources
- Fundamental data encompasses financial information about a company or asset’s underlying value.
- Investors use this data to assess the intrinsic worth of an investment.
- Financial Statements
- Company financial statements, such as income statements, balance sheets, and cash flow statements, provide insights into a company’s financial health.
- These statements reveal revenue, expenses, assets, liabilities, and cash flow.
- Earnings Reports
- Quarterly and annual earnings reports disclose a company’s profitability and growth.
- Investors scrutinize earnings to evaluate performance and make investment decisions.
- Economic Indicators
- Economic data, such as GDP growth, inflation rates, and employment numbers, impact financial markets.
- Investors use economic indicators to gauge the overall health of an economy.
- Industry and Market Reports
- Industry reports offer insights into specific sectors, analyzing trends and opportunities.
- Market reports provide broader market perspectives, aiding in portfolio allocation.
- News and Press Releases
- Company news and press releases can influence stock prices and market sentiment.
- Investors stay updated on relevant news to make informed trading choices.
- Regulatory Filings
- Publicly traded companies submit regulatory filings to regulatory authorities.
- Examples include 10-K, 10-Q, and 8-K reports, which contain crucial financial and business information.
- Technical Data Sources
- Technical data involves analyzing historical price and volume patterns to forecast future price movements.
- Traders use this data to identify trends, support and resistance levels, and chart patterns.
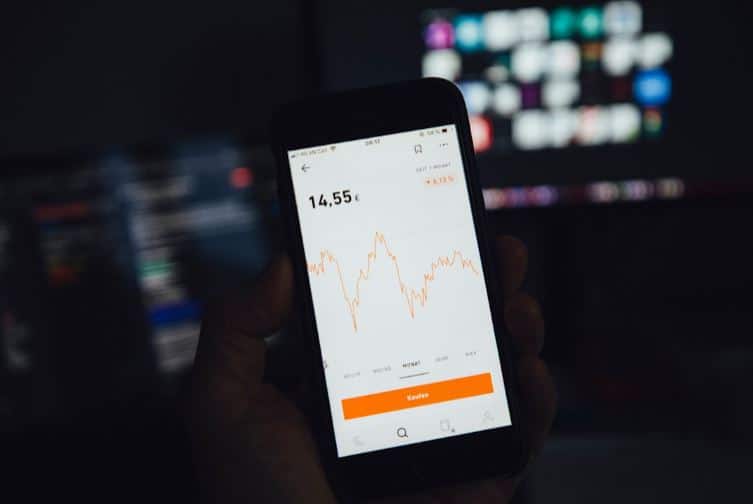
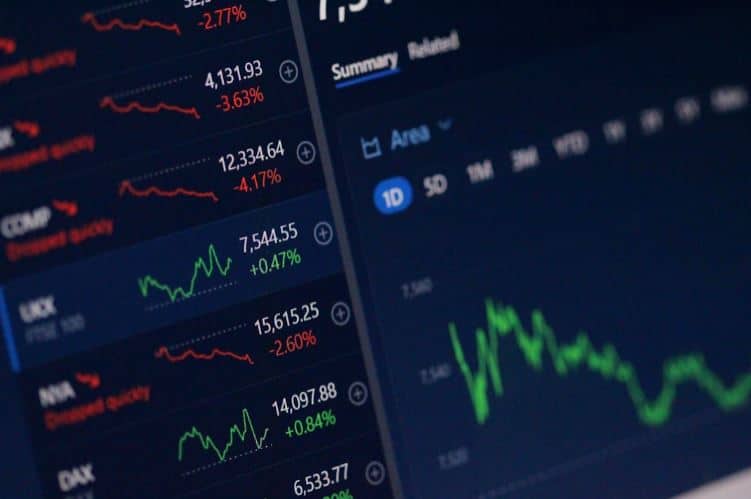
- Price Charts
- Candlestick, line, and bar charts provide visual representations of price movements over time.
- Technical analysts use these charts to identify patterns and trends.
- Indicators and Oscillators
- Technical indicators, like Moving Averages, Relative Strength Index (RSI), and Moving Average Convergence Divergence (MACD), provide mathematical calculations based on price and volume data.
- These indicators aid in determining market momentum and potential entry and exit points.
- Volume Data
- Volume data indicates the number of shares or contracts traded in a specific period.
- Volume analysis helps confirm price trends and identify significant price movements.
Both fundamental and technical data sources play vital roles in the world of finance. Fundamental data provides insights into the intrinsic value of investments, while technical data aids in understanding market trends and price patterns. As traders and investors, leveraging these data sources empowers us to make well-informed decisions, navigate the markets, and potentially achieve financial success. Remember, knowledge is the key, and understanding the data is your compass in the vast sea of financial opportunities. Happy investing and trading!